Getting Started
User Guide
Reference documentation
Getting help and contributing
This gallery contains examples of what PyGMT can do. Click on any example to see the code used to generate it.
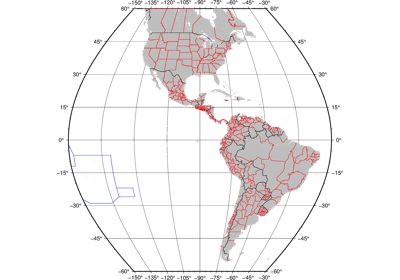
Political Boundaries
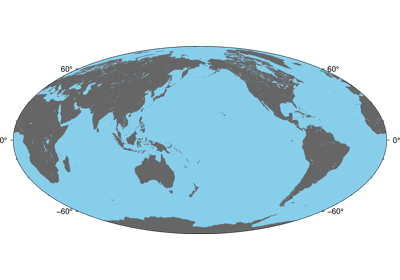
Color land and water
Shorelines
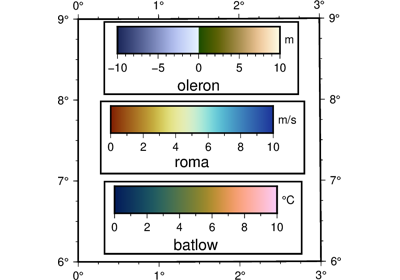
Colorbar
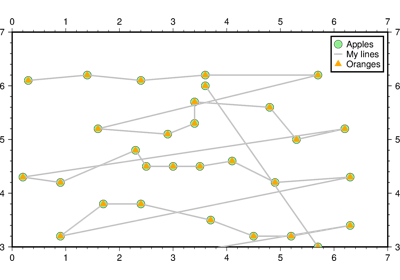
Legend
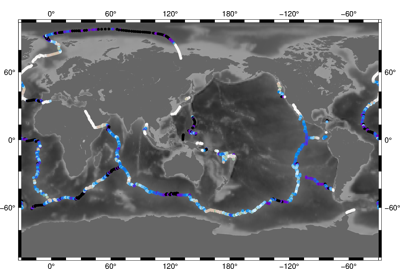
Points
Sampling along tracks
Gallery generated by Sphinx-Gallery